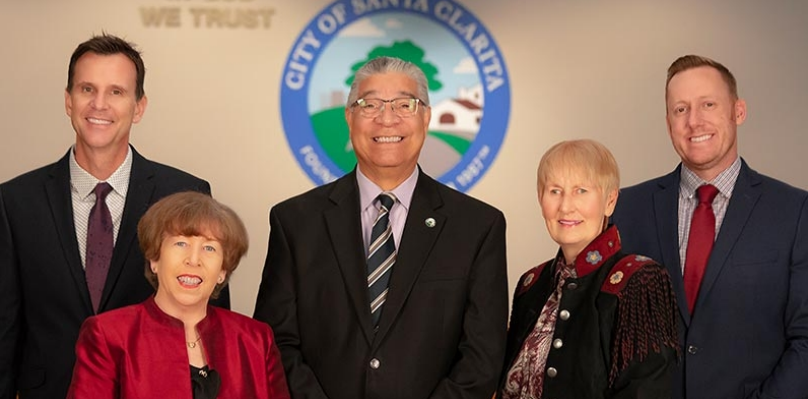
Santa Clarita, California Economic Development
Home Film Tourism Redevelopment Business Relocation

Quality of Life

  Geography  
  Public Safety  
  Transportation  


Geography/Location

Located 35 miles northwest of downtown Los Angeles, the City of Santa Clarita encompasses 52.032 square miles of the approximately 200-square mile Santa Clarita Valley. Therefore, the City of Santa Clarita is the largest in geographic size within the County of Los Angeles. The City is situated south of the sierra Pelona mountain range and north of the Santa Susanna and San Gabriel mountain ranges between Interstate 5 and State Highway 14.


The latitude and longitude for Santa Clarita City Hall is 34°24'46" North and 118°33'6" West.
The City of Santa Clarita’s elevation is 1,200 feet above sea level. (Source: U.S. Geological Service)


Mileage to Key Centers

LOCATION

DISTANCE (miles)
(MILES)

DIRECTIONAL
Los Angeles International Airport (LAX) 40 south
Downtown Los Angeles 35 southeast
Burbank Airport (BUR) 25 south
Palmdale / Lancaster 35 northeast
San Fernando Valley 8 south
Port of Los Angeles 60 south
Port Hueneme 30 west


Climate

Santa Clarita enjoys a mild Southern California Mediterranean climate.

  • Summers are dry and warm in the 75° - 100° range.
  • Winters are temperate and semi-moist in the 40° - 65° range.
  • Precipitation reaches 15 to 18 inches primarily between November and March

back to top

PUBLIC SAFETY

Based on statistics released by the Federal Bureau of Investigation (June 2003), Santa Clarita is the 5th safest city among cities in California of at least 100,000 in population. Based on cities with a population of at least 150,000 people, Santa Clarita is the safest in California and as well as in the country.

Part I crimes have increased by 0.5% in the City of Santa Clarita from 2001 to 2002, yet remain below the levels reported in 1996. Part I crimes, or “serious crimes,” are those defined by the FBI as criminal homicide, forcible rape, robbery, aggravated assault, burglary, larceny, grand theft auto, and arson.


Source: Los Angeles County Sheriff's Department Year in Review


back to top


TRANSPORTATION

Travel Time to Work
Approximately 3% of Santa Clarita residents at least 16 years of age who are employed work at home. The remaining 97% of residents travel an average of 33.0 minutes to work.

Commuting Method

% of Workers

Drive alone

78.0%

Carpool

13.6%

Public transportation

3.0%

Walk

1.3%

Other means

0.9%

Work at home

3.2%

Source: 2000 Bureau of the Census

Slightly less than one-half of those who commute to work, leave their homes between 5:00 AM and 7:30 AM.


Source: U.S. Bureau of the Census, 2000

Public Transit Ridership

Santa Clarita Transit has experienced a 459% increase in the number of passengers utilizing the public transportation from Fiscal Year (FY) 1991-1992 to the estimated number of riders in FY 2000-2001. (Note: a fiscal year begins on July 1st and ends on June 30th.)


Source: Santa Clarita Transit, December 2001. FY 2000-2001 is unaudited.

The information above and in the table reflect data from July 1st through June 30th.

FISCAL YEAR
# OF RIDERS
1991-1992
530,222
1992-1993
935,261
1993-1994
1,098,564
1994-1995
1,345,710
1995-1996
1,619,037
1996-1997
1,777,857
1997-1998
2,002,907
1998-1999
2,235,079
1999-2000
2,384,919
2000-2001 (unaudited)
2,964,789

Source: Santa Clarita Transit, December 2001

back to top

*Some of these documents are in Adobe Acrobat Reader format;
if you don't have the Reader, it can be downloaded for free.